

Research ArticleOpen Access, Volume 4 Issue 2
The epidemiology of coeliac disease in the United Kingdom since 2000: A narrative review and meta-analysis of peer-reviewed and grey literature
Craig J Currie*; Jessica G Currie
Global Epidemiology, Human Data Sciences, Cardiff, UK.
*Corresponding author: Craig Currie
Global Epidemiology, Human Data Sciences, Cardiff, UK.
Email: craig.currie@humandatasciences.com
Received : Mar 20, 2026 Accepted : Apr 13, 2026 Published : Apr 20, 2026
Epidemiology & Public Health - www.jpublichealth.org
Copyright: Currie CJ © All rights are reserved
Citation: Currie CJ, Currie JG. The epidemiology of coeliac disease in the United Kingdom since 2000: A narrative review and meta-analysis of peer-reviewed and grey literature. Epidemiol Public Health. 2026; 4(2): 1097.
Abstract
Objective: To synthesize the epidemiology of coeliac disease in the United Kingdom since 2000, integrating peer reviewed and grey literature and quantitatively pooling community screening prevalence where appropriate.
Design: Structured narrative review and random-effects meta-analysis.
Data sources: MEDLINE/PubMed, Europe PMC and targeted searches of UK grey-literature sources (National Institute for Health and Care Excellence, UK National Screening Committee, Coeliac UK and the All-Party Parliamentary Group on Coeliac Disease) from 1 January 2000 to 9 March 2026.
Eligibility criteria: UK-based publications reporting prevalence, incidence, temporal trends, demographic variation, geographic variation, socioeconomic patterning, ethnic patterning or diagnostic under-ascertainment in coeliac disease.
Data extraction and synthesis: We narratively synthesized all eligible evidence. For quantitative synthesis, we prespecified non-overlapping community screening studies with extractable numerators and denominators and pooled prevalence using a logit-transformed random-effects model. Routine-data incidence and prevalence studies were not pooled because of overlapping populations, heterogeneous case definitions and evolving diagnostic pathways.
Results: Sixteen peer-reviewed publications and four grey literature documents were included. Three non-overlapping community screening studies (n=14 220) yielded a pooled prevalence of previously undetected coeliac disease of 1.08% (95% CI 0.92% to 1.26%; I²=0%). Diagnosed incidence rose sharply across regional and national datasets: in nationwide routine data, incidence increased from 5.2 per 100 000 person-years in 1990 to 19.1 per 100 000 in 2011, while a more recent UK routine-data analysis reported an incidence of 17.5 per 100 000 person-years during 2000 2020. Recorded prevalence increased from 0.24% in 2011 to 0.36% in 2020. Childhood incidence rose substantially in Scotland and Wales, but deprivation-related and regional inequalities persisted. Across contemporary datasets, females were diagnosed almost twice as often as males, diagnosis was less frequent in more deprived communities, and grey literature suggested continuing ethnic inequities.
Conclusion: UK epidemiology since 2000 shows a consistent central paradox: screened prevalence remains close to 1%, but diagnosed prevalence in routine care remains far lower. Case ascertainment has improved markedly, yet substantial underdiagnosis and social inequity remain. Future UK research and policy should prioritise equitable testing pathways, sharper evidence on ethnic variation, and formal evaluation of whether current case finding is sufficient or whether broader screening strategies merit implementation.
Keywords: Coeliac disease; Celiac disease; Epidemiology; Prevalence; Incidence; United kingdom; Screening; Health inequalities.
Introduction
Coeliac disease is no longer an uncommon or predominantly pediatric malabsorption syndrome. UK studies published since 2000 have consistently shown that approximately 1% of the population has evidence of disease, yet the majority of affected people remain undiagnosed [1-4]. At the same time, diagnosed incidence and recorded prevalence have risen substantially across regional and national datasets [5-16]. This combination of rising recognition and persistent under-ascertainment has major implications for patients, health services and policy makers.
Several features make the UK an especially important setting in which to understand coeliac epidemiology. First, the country has produced influential population screening studies, richly phenotyped regional cohorts and large routine-data analyses spanning multiple decades [1-16]. Secondly, UK clinical guidance has explicitly promoted active case finding: NICE guideline NG20, published in 2015 and reviewed without update in 2019, supports serological testing in people with suggestive symptoms and in selected at-risk groups [17]. Thirdly, pressure has grown to revisit whether case finding alone is enough. In 2025 the UK National Screening Committee commissioned an evidence map on coeliac disease screening, underscoring that this is now an active policy question rather than a settled one [18].
A contemporary UK-focused synthesis is therefore needed. Existing international reviews are helpful but cannot resolve UK specific questions about absolute burden, changes over time, regional heterogeneity, deprivation gradients, ethnic patterning, or the extent to which modern routine-data prevalence has caught up with long-standing screened prevalence estimates. We aimed to provide a narrative review and meta-analysis of peer-reviewed and grey literature describing the epidemiology of coeliac disease in the UK since 2000.
Methods
Review design
We undertook a structured narrative review with a targeted quantitative synthesis. The narrative review was chosen because the UK evidence base comprises heterogeneous designs, including community screening studies, regional case-series with defined catchment populations, national and regional routine-data studies, and grey-literature reports. A single pooled estimate across all prevalence and incidence studies would have been methodologically unsound because of overlapping populations, differing denominators, evolving diagnostic pathways and changing case definitions over time.
Search strategy and information sources
Using a large language model we searched MEDLINE/ PubMed and Europe PMC for studies published from 1 January 2000 to 9 March 2026 using combinations of terms for coeliac/ celiac disease, epidemiology, prevalence, incidence, screening, diagnosis, children, adults, deprivation, ethnicity and the United Kingdom (including England, Scotland, Wales and Northern Ireland). We supplemented this with citation chasing of key UK studies and targeted grey-literature searches of NICE, the UK National Screening Committee, Coeliac UK and the All-Party Parliamentary Group on Coeliac Disease. Representative search strings are provided in (Appendix 1).
Eligibility criteria
We included peer-reviewed publications and grey literature reports if they: (1) focused on the UK or a UK nation/ region; (2) were published in or after 2000; and (3) reported epidemiologically relevant outcomes, including incidence, prevalence, temporal trends, geographical variation, sex differences, age patterns, deprivation, ethnicity, screening yield or diagnostic under-ascertainment. We excluded non-UK studies, studies published before 2000, case reports without population denominators, and papers concerned purely with treatment or complications without epidemiological data.
Study selection, extraction and appraisal
For each included publication we extracted study design, setting, population, time period, numerator and denominator data where available, and the main epidemiological findings. We appraised studies narratively across five domains: population coverage, clarity of case definition, denominator validity, temporal comparability and likely risk of ascertainment bias. Grey-literature sources were not formally risk-scored but were used primarily for policy context, diagnostic delay and health-system interpretation rather than as sole evidence for core burden estimates.
Quantitative synthesis
We prespecified that only non-overlapping community screening studies with extractable numerators and denominators would be meta-analyses. The pooled prevalence of previously undetected coeliac disease was estimated using a logit-transformed random-effects model with inverse variance weighting. Exact 95% confidence intervals were calculated for individual studies, and statistical heterogeneity was summarized using I². Because there were only three eligible studies, the pooled analysis was intended to provide a descriptive UK benchmark rather than a definitive national prevalence estimate.
Patient and public involvement
Patients and/or the public were not involved in the design, conduct, reporting or dissemination plans of this review.
Results
Overview of the evidence
We included 16 peer-reviewed publications and 4 grey literature publications. The peer-reviewed literature comprised three community screening studies, multiple regional incidence and prevalence studies, two Scottish pediatric studies, one UK-wide childhood routine-data analysis, two large UK-wide routine-data studies in all ages, and focused analyses of social and ethnic variation. Grey literature contributed information on guideline context, screening policy, diagnostic delay and wider inequalities.
Community screening prevalence and the submerged disease burden
Three non-overlapping UK community screening studies published since 2000 gave remarkably consistent prevalence estimates for previously undetected disease. In adults aged 45 76 years in Cambridge, West and colleagues identified 87 anti endomysia antibody-positive participants among 7,550 adults, a prevalence of 1.2% [1]. In South Yorkshire primary care, Sanders and colleagues diagnosed 12 previously unrecognized cases among 1,200 volunteers, a prevalence of 1.0% [2]. In the ALSPAC birth cohort, Bingley and colleagues found undiagnosed coeliac disease in 54 of 5,470 children aged 7 years, again approximately 1.0% [3].
Pooling these three studies produced a prevalence of previously undetected coeliac disease of 1.08% (95% CI 0.92% to 1.26%; I²=0%) (Figure 1 and Appendix Table A1). Restricting the analysis to the two adult studies yielded a very similar estimate of 1.13% (95% CI 0.93% to 1.38%; I²=0%). The consistency of these estimates across different UK populations strengthens the inference that the underlying prevalent burden in the UK has been close to 1% throughout the modern serology era.
The follow-up analysis of the Avon cohort added a crucial clinical message: more than 90% of childhood disease was likely to be going undiagnosed despite a screened prevalence of at least 1% [4]. This finding remains highly relevant when interpreting later increases in recorded incidence, because it implies that rising diagnosis rates should not be assumed to mean the diagnosis gap has been closed.
Trends in diagnosed incidence and prevalence in adults and the whole population
Regional studies documented substantial increases in diagnosed incidence before the publication of national routine data analyses. In South Glamorgan, Hawkes and colleagues reported that adult incidence increased from 1.32 to 3.08 per 100 000 between 1981 and 1995, with almost half of adults diagnosed after the age of 50 years [5]. In East Dorset, Fowell and colleagues reported an overall incidence of 8.7 per 100 000 per year during 1993-2002 and estimated that biopsy-proven prevalence increased from 0.18% to 0.40% over the study period [6]. In Cardiff and the Vale of Glamorgan, adult incidence rose further to 11.13 per 100 000 by 2005, while pediatric incidence trebled to 6.89 per 100 000; importantly, serological testing increased 14-fold while diagnostic yield per test fell from 5.8% to 1.1% [7].
The most important national benchmark from the earlier routine-data era came from West and colleagues, who analyses the Clinical Practice Research Datalink between 1990 and 2011 [11]. They identified 9,087 incident coeliac disease cases and showed that incidence rose from 5.2 per 100 000 person-years in 1990 to 19.1 per 100 000 in 2011 [11]. Point prevalence on 30 June 2011 was 0.24%, equivalent to roughly 1 in 420 people [11]. The same study demonstrated marked regional heterogeneity, with higher diagnosed incidence and prevalence in Northern Ireland and lower estimates in London [11].
A more recent UK routine-data analysis covering 2000-2020 reported 50,416 new diagnoses during 28.8 million person years of follow-up, corresponding to an incidence of 17.5 per 100 000 person-years [16]. Recorded prevalence in 2020 was 0.36%, or 1 in 278 people [16]. Prevalence had almost doubled since 2010, confirming continuing growth in the recorded burden of diagnosed disease, but even this contemporary figure remained far below the approximately 1% prevalence suggested by community screening studies.
Pediatric epidemiology
The pediatric literature shows both a real rise in diagnosis and persistent under-recognition. In southeast Scotland, White and colleagues identified 266 children diagnosed between 1990 and 2009 and reported an increase in incidence from 1.8 per 100 000 in 1990-1994 to 11.7 per 100 000 in 2005-2009 [9]. Non-classic and screened cases increased substantially, but the incidence of classic presentations also rose, suggesting that the trend was not explained solely by broader testing [9].The pediatric literature shows both a real rise in diagnosis and persistent under-recognition. In southeast Scotland, White and colleagues identified 266 children diagnosed between 1990 and 2009 and reported an increase in incidence from 1.8 per 100 000 in 1990-1994 to 11.7 per 100 000 in 2005-2009 [9]. Non-classic and screened cases increased substantially, but the incidence of classic presentations also rose, suggesting that the trend was not explained solely by broader testing [9].
In a separate prospective national study, White and colleagues reported 91 new Scottish pediatric cases during 2009-2010, giving an overall adjusted incidence of 10.0 per 100 000 per year [10]. Incidence differed substantially between regions: 16.3 per 100 000 in eastern Scotland, 8.1 per 100 000 in the west and 7.7 per 100 000 in the north [10]. The east also undertook more diagnostic antibody testing and diagnosed more cases through active screening, indicating that clinician behavior and service configuration contributed to regional variation [10].
South Wales data showed a similar pattern of increasing diagnosis and changing presentation. Between 2005 and 2011, Whyte and Jenkins recorded 163 pediatric cases (23 per year), compared with 50 cases (8 per year) between 1999 and 2004, 25 cases between 1990 and 1998 and 11 cases between 1983 and 1989 [8]. More than one-third of cases were asymptomatic and detected after targeted screening of high-risk groups [8]. Across the UK as a whole, Zingone and colleagues identified 1247 childhood diagnoses among more than 2 million children between 1993 and 2012, corresponding to an overall incidence of 11.9 per 100 000 person-years [12].
Yet rising childhood diagnosis should not be mistaken for adequate case ascertainment. In the South West of England, Whitburn and colleagues estimated that at least 83% of cases in Bristol and 91% of cases across the wider region were still being missed during 1999-2010 [15].
Sex, age, deprivation, geography and ethnicity
Sex differences were consistent across datasets. In the 1990 2011 UK routine-data analysis, females had almost twice the incidence of diagnosed coeliac disease as males (adjusted incidence rate ratio 1.85) [11]. In the 2000-2020 UK routine data analysis, the female excess persisted (IRR 1.95) [16]. This diagnostic pattern was mirrored in pediatric analyses, with higher incidence in girls than boys [9,12].
Age patterns were also striking. National routine-data analyses showed a bimodal distribution, with peaks in early childhood and later adulthood, particularly after the age of 50 years [11,16]. Derbyshire data highlighted the age shift even more clearly: by 2010-2014, 27% of diagnoses occurred in people aged 60 years or over, and diagnoses in young men remained relatively uncommon [14]. In South Glamorgan, almost half of adults were already aged over 50 years at diagnosis in the earlier era [5].
Socioeconomic gradients were among the most consistent inequality signals in the UK literature. Zingone and colleagues found that children living in the least deprived areas were 80% more likely to be diagnosed than those in the most deprived areas [12]. Whitburn and colleagues similarly found that childhood diagnosis rates were 1.6 times higher in the least deprived than in the most deprived communities in South West England, with an even wider gap within Bristol [15]. Contemporary UK routine data analyses in all ages also reported lower diagnosis rates in more deprived areas, although Northern Ireland remained an exception because overall incidence there was high [11,16].
Geographical variation has been repeatedly observed. West and colleagues reported the highest UK incidence in Northern Ireland and the lowest in London [11]. In Scotland, pediatric incidence was markedly higher in the east than in the west or north [10]. These differences are unlikely to reflect genetics alone; they are more plausibly a mixture of healthcare access, testing thresholds, service organization and true environmental variation.
Evidence on ethnicity is thinner than evidence on sex or deprivation, but the available literature suggests that under recognition is unevenly distributed. In southern Derbyshire, Holmes and Moor found that coeliac disease was more frequent in Asian than in white individuals, particularly among women aged 16-59 years; Asian patients were more likely to present with anaemia and less likely to present with diarrhoea [13]. The later Derbyshire audit also showed that diagnoses in Asian patients increased substantially over time but remained rare in Asian adults aged 60 years or over [14]. Grey literature from the APPG on Coeliac Disease, citing University of Nottingham evidence, reported that diagnosis rates in Black British people were only around one-fifth of those in White British people [20]. This finding should be interpreted cautiously because the underlying analysis has not yet been fully published as a peer reviewed epidemiological paper, but it is important enough to highlight as a potential major inequity.
Grey literature synthesis
Grey literature sharpened the policy interpretation of the peer-reviewed findings. NICE guideline NG20, published in 2015 and reviewed in 2019, continues to support current recommendations on recognition and testing rather than recommending population screening [17]. The 2025 UK National Screening Committee evidence map concluded that the evidence base on screening was substantial enough to justify further commissioned synthesis work, showing that the screening question remains live [18].
Coeliac UK has framed the current UK burden as approximately 500 000 people living with undiagnosed disease and only 36% of affected people having a medical diagnosis [19]. Although advocacy estimates should not be treated as equivalent to peer-reviewed prevalence studies, they are broadly consistent with the gap between pooled screened prevalence (~1.1%) and recorded routine-data prevalence (0.36% in 2020) [1-3,16,19]. The APPG report similarly emphasised prolonged diagnostic delay and inequities in access to diagnosis [20].
Table 1: Details of source materials.
| Ref | Study | Design | Setting/population | Study period | Main epidemiological contribution |
|---|---|---|---|---|---|
| 1 | West 2003 | Community serology screen | Cambridge adults aged 45–76 years | 1990–1995 sampling; published 2003 | 87/7550 EMA-positive; prevalence 1.2% (95% CI 0.9 to 1.4). |
| 2 | Sanders 2003 | Primary care cross-sectional screen | Five GP practices, South Yorkshire adults | 1999–2001 | 12/1200 biopsy-confirmed; prevalence 1.0% (95% CI 0.4 to 1.3). |
| 3 | Bingley 2004 | Birth cohort serology screen | ALSPAC children aged 7 years | Published 2004 | 54/5470 screen-positive; prevalence about 1.0%. |
| 4 | Ravikumara 2007 | Birth cohort follow-up analysis | ALSPAC-related paediatric follow-up | Published 2007 | >90% of childhood coeliac disease estimated to remain undiagnosed. |
| 5 | Hawkes 2000 | Regional retrospective case finding | South Glamorgan | 1981–1995 | Adult incidence rose from 1.32 to 3.08 per 100,000; children stable. |
| 6 | Fowell 2006 | Prospective regional observational study | East Dorset | 1993–2002 | Overall incidence 8.7 per 100,000/year; prevalence from 0.18% to 0.40%. |
| 7 | Hurley 2012 | Regional retrospective case finding | Cardiff and Vale of Glamorgan | 1996–2005 | Adult incidence rose to 11.13 per 100,000; paediatric incidence 6.89 per 100,000; serology testing rose 14-fold. |
| 8 | Whyte 2013 | Regional paediatric review | South Wales | 2005–2011 compared with 1983–2004 | 23 paediatric cases/year; 36% diagnosed after targeted screening. |
| 9 | White 2013 | Paediatric retrospective cohort | Southeast Scotland | 1990–2009 | Incidence rose from 1.8 to 11.7 per 100,000; classic cases also increased. |
| 10 | White 2013 SPSU | National paediatric surveillance | Scotland | 2009–2010 | Adjusted incidence 10.0 per 100,000/year; strong east–west–north gradient. |
| Ref | Study | Design | Setting/population | Study period | Main epidemiological contribution |
| 11 | West 2014 | Nationwide routine-data cohort | UK CPRD | 1990–2011 | Incidence rose from 5.2 to 19.1 per 100,000; prevalence 0.24% in 2011. |
| 12 | Zingone 2015 | Nationwide child routine-data cohort | UK CPRD | 1993–2012 | Child incidence 11.9 per 100,000 person-years; least deprived 80% more likely to be diagnosed. |
| 13 | Holmes and Moor 2012 | Single-centre audit | Southern Derbyshire Asians versus white patients | 1958–2008 diagnoses | Higher frequency in Asian than white individuals; Asian patients more likely to present with anaemia. |
| 14 | Holmes and Muirhead 2017 | Single-centre epidemiological audit | Southern Derbyshire | 1958–2014 | Twenty-fold rise in diagnoses versus 1970s; 27% diagnosed aged ≥60 years; prevalence 1:188 in 2014. |
| 15 | Whitburn 2021 | Regional paediatric cohort | South West England/Bristol | 1999–2010 | Diagnosis rates rose, but estimated missed cases remained 83–91%; deprivation gap widened. |
| 16 | Nartey 2023 | Nationwide routine-data cohort | UK CPRD | 2000–2020 | Incidence 17.5 per 100,000 person-years; prevalence 0.36% in 2020; inequalities by sex, deprivation, geography and ethnicity. |
Box 1: Grey-literature sources and what they add to the synthesis.
| Ref | Source | Contribution to interpretation |
|---|---|---|
| 17 | NICE NG20 and 2019 surveillance | Confirms UK guidance based on active case finding; 2019 surveillance concluded no update was required at that time. |
| 18 | UK National Screening Committee evidence map | Shows that the screening question remains active in UK policy and that further commissioned synthesis is warranted. |
| 19 | Coeliac UK 2025 press release | Provides contextual estimate of approximately 500,000 undiagnosed people and suggests only 36% are medically diagnosed. |
| 20 | APPG on Coeliac Disease report | Highlights diagnostic delay, pathway problems and possible ethnic inequities, including lower diagnosis rates reported in Black British populations. |
Table 2: Key contemporary UK epidemiological benchmarks.
| Domain | Estimate | Source/interpretation |
|---|---|---|
| Previously undetected community prevalence | 1.08% (95% CI 0.92% to 1.26%) | Random-effects meta-analysis of 3 UK screening studies |
| Adult-only screened prevalence (sensitivity analysis) | 1.13% (95% CI 0.93% to 1.38%) | Random-effects meta-analysis of 2 adult studies |
| Recorded diagnosed prevalence, UK 2011 | 0.24% (1 in 420) | UK CPRD routine data |
| Recorded diagnosed prevalence, UK 2020 | 0.36% (1 in 278) | UK CPRD routine data |
| Recorded diagnosed incidence, UK 1990 | 5.2 per 100,000 person-years | UK CPRD routine data |
| Recorded diagnosed incidence, UK 2011 | 19.1 per 100,000 person-years | UK CPRD routine data |
| Recorded diagnosed incidence, UK 2000–2020 | 17.5 per 100,000 person-years | UK CPRD routine data |
| Childhood incidence, southwest Scotland 2005–2009 | 11.7 per 100,000 | Retrospective regional cohort |
| Childhood incidence, Scotland 2009–2010 | 10.0 per 100,000/year | National prospective surveillance |
| Deprivation gradient in UK children | Least deprived 80% more likely to be diagnosed than most deprived | Nationwide child routine-data study |
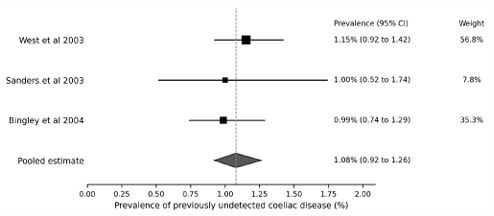
Forest plot of the three non-overlapping UK community screening studies included in the meta-analysis [1-3]. The pooled estimate was obtained using a logit-transformed random-effects model. Exact source data needed to reconstruct this figure are provided in (Appendix Table A1).
Appendix 1: Representative search strategy and figure source data
Databases searched: MEDLINE/PubMed and Europe PMC. Grey-literature sources searched directly: NICE, UK National Screening Committee, Coeliac UK and the APPG on Coeliac Disease.
Representative peer-reviewed search string: (coeliac OR celiac) AND (United Kingdom OR UK OR England OR Scotland OR Wales OR "Northern Ireland") AND (epidemiology OR prevalence OR incidence OR screening OR diagnosis OR underdiagnosis OR deprivation OR ethnicity).
Representative grey-literature search terms: coeliac disease NICE NG20; coeliac disease UK National Screening Committee; Coeliac UK undiagnosed; APPG coeliac disease diagnosis.
Appendix Table A1: Source data used to construct Figure 1.
| Row | Study | Cases | Denominator | Prevalence (%) | Lower 95% CI | Upper 95% CI | Weight (%) |
|---|---|---|---|---|---|---|---|
| 1 | West et al 2003 | 87 | 7550 | 1.15 | 0.92 | 1.42 | 56.8 |
| 2 | Sanders et al 2003 | 12 | 1200 | 1.00 | 0.52 | 1.74 | 7.8 |
| 3 | Bingley et al 2004 | 54 | 5470 | 0.99 | 0.74 | 1.29 | 35.3 |
| Pooled | Pooled estimate | 1.08 | 0.92 | 1.26 | 100.0 |
Discussion
Principal findings
The central epidemiological message is straightforward but important: in the UK, the burden of coeliac disease detected by community screening has remained close to 1%, whereas the burden captured in routine diagnosed prevalence, although rising rapidly, remained only 0.36% in 2020 [1-3,16]. Put differently, modern UK healthcare appears to recognize substantially more coeliac disease than it did two decades ago, but it still captures only around one-third of the likely prevalent burden.
This helps reconcile two observations that can otherwise seem contradictory: incidence has risen steeply, yet underdiagnosis remains substantial. The rise in incidence is real in the sense of diagnosed incidence, but much of it appears to reflect better ascertainment, broader serological testing, active case finding and greater recognition of non-classic disease rather than a complete convergence between diagnosed and underlying disease occurrence [7,9-12,16].
Interpretation of trends
The UK literature suggests at least four interacting drivers of observed trends. First, serological testing changed the case mix by lowering the threshold to investigate people with atypical symptoms or associated conditions [7-10]. Secondly, awareness among paediatricians and gastroenterologists increased, allowing more asymptomatic or minimally symptomatic individuals to be detected through high-risk screening [8-10]. Thirdly, coding quality and the scale of routine-data research improved, making national burden easier to quantify [11,16]. Fourthly, there may have been some genuine change in incidence, especially in childhood, because classic presentations rose as well as screened and non-classic cases in southeast Scotland [9]. However, the epidemiological balance of evidence points much more strongly towards improved detection than towards an explosive increase in true underlying disease frequency.
Health inequalities and missed opportunities
The persistence of deprivation gradients is one of the most concerning findings in the contemporary UK evidence base. It is biologically implausible that coeliac disease should be dramatically less common in poorer communities. A more credible explanation is unequal recognition: differences in consulting behaviour, symptom attribution, access to testing, follow-through to endoscopy, and clinician thresholds for considering the diagnosis [12,15,16]. The same logic probably applies to ethnic inequities, where the limited evidence available suggests that the disease may be under-recognized rather than truly rare in some groups [13,20].
The age and sex findings are also clinically revealing. Women The age and sex findings are also clinically revealing. Women have consistently higher diagnosis rates than men, but older adults, especially men, remain a group in whom diagnosis may be delayed or missed [5,11,14,16]. UK clinicians may still implicitly associate coeliac disease with younger women, gastrointestinal symptoms or childhood presentations, even though the epidemiology shows a much broader and older distribution.
Implications for practice and policy
These findings support a stronger emphasis on equitable case finding within existing UK guidance. NICE already recommends testing in a wide range of symptomatic and at-risk groups [17]; the problem may therefore be less a lack of guidance than inconsistent implementation. Primary care, diabetes care, thyroid clinics, haematology services, osteoporosis pathways and gastroenterology services all remain important points at which missed diagnoses could be reduced.
At the same time, the review strengthens the argument that the UK should continue to evaluate screening more formally. The UK National Screening Committee evidence map and the pediatric underdiagnosis data show that this debate is no longer hypothetical [15,18]. Whether population screening, age-targeted screening or more intelligent risk-stratified case finding would produce the best balance of benefit, harm, cost and feasibility remains unresolved. But current pathways plainly do not identify all, or even most, prevalent disease.
Strengths and limitations
This review has several strengths. It is UK-specific, spans both peer-reviewed and grey literature, and explicitly separates screened prevalence from diagnosed prevalence and incidence rather than treating them as interchangeable. It also adds a quantitative pooled estimate of community screening prevalence and provides appendix source data to allow figure reconstruction.
The limitations are equally important. This was a structured narrative review with a targeted meta-analysis, not a de novo full systematic review of every possible database and conference source. Only three studies were suitable for quantitative synthesis. The most contemporary national estimate came from a conference abstract rather than a full peer-reviewed paper16. Many incidence and prevalence datasets overlapped in time or population and therefore could not be pooled without risk of double counting. Finally, grey literature is valuable for policy context but is intrinsically more vulnerable to advocacy bias and incomplete methodological description than peer-reviewed epidemiology.
Conclusion
Since 2000, UK epidemiology has shown that coeliac disease is both common and incompletely recognized. The best community screening evidence still points to a population prevalence of about 1%, while diagnosed prevalence in routine care reached only 0.36% by 2020 [1-3,16]. Diagnosis has improved substantially, but the UK still has a large submerged burden of disease, and the people least likely to be diagnosed appear to include those living in deprived communities and some ethnic minority groups [12-16,20].
For clinicians, the implication is that coeliac disease should remain firmly in mind across a broader age, symptom and social spectrum than traditional teaching suggests. For policy makers, the implication is that the key question is no longer whether coeliac disease matters as a population problem, but whether current UK diagnostic pathways detect enough of it, fairly enough and early enough.
What is already known on this topic
• UK population screening studies have long suggested that around 1 in 100 people have coeliac disease, but most cases are not clinically recognized.
• Routine UK datasets have shown rising incidence and prevalence, but previous evidence has been scattered across regional pediatric, regional adult and national primary care studies.
What this study adds
• This review brings together peer-reviewed and grey literature on UK coeliac disease epidemiology since 2000 and adds a quantitative synthesis of non-overlapping community screening studies.
• The pooled prevalence of previously undetected coeliac disease in UK screening studies was 1.08% (95% CI 0.92% to 1.26%), whereas recorded UK prevalence in routine data was only 0.36% in 2020.
• Diagnosis rates have improved, but inequalities by sex, deprivation, geography and probably ethnicity persist.
How this study might affect research, practice or policy
• The evidence supports renewed emphasis on equitable case finding in primary and secondary care, especially in men, older adults, deprived populations and underserved ethnic groups.
• UK policy discussions should move beyond whether coeliac disease is common enough to matter and towards whether current pathways detect enough of it, fairly enough, and early enough.
Declarations
Data availability statement: All data relevant to the study are included in the article, appendix and reference list. Figure source data required to reconstruct (Figure 1 are provided in Appendix Table A1).
Ethics approval: Not required because this study synthesised published and publicly accessible material.
Competing interests: No conflicts of interest.
Author contributions: Both authors were involved with preparing the LLM prompts and for reviewing the narrative.
References
- West J, Logan RFA, Hill PG, Lloyd A, Lewis S, Hubbard R, et al. Seroprevalence, correlates, and characteristics of undetected coeliac disease in England. Gut. 2003; 52: 960–5.
- Sanders DS, Patel D, Stephenson TJ, Ward AM, McCloskey EV, Hadjivassiliou M, et al. A primary care cross-sectional study of undiagnosed adult coeliac disease. Eur J Gastroenterol Hepatol. 2003; 15: 407–13.
- Bingley PJ, Williams AJK, Norcross AJ, Unsworth DJ, Lock RJ, Ness AR, et al. Undiagnosed coeliac disease at age seven: population based prospective birth cohort study. BMJ. 2004; 328: 322–3.
- Ravikumara M, Nootigattu VKT, Sandhu BK. Ninety percent of celiac disease is being missed. J Pediatr Gastroenterol Nutr. 2007; 45: 497–9.
- Hawkes ND, Swift GL, Smith PM, Jenkins HR. Incidence and presentation of coeliac disease in South Glamorgan. Eur J Gastroenterol Hepatol. 2000; 12: 345–9.
- Fowell AJ, Thomas PW, Surgenor SL, Snook JA. The epidemiology of coeliac disease in East Dorset 1993–2002. QJM. 2006; 99: 453–60.
- Hurley JJ, Lee B, Turner JK, Beale A, Jenkins HR, Swift GL. Incidence and presentation of reported coeliac disease in Cardiff and the Vale of Glamorgan. Eur J Gastroenterol Hepatol. 2012; 24: 482–6.
- Whyte LA, Jenkins HR. The epidemiology of coeliac disease in South Wales: a 28-year perspective. Arch Dis Child. 2013; 98: 405–7.
- White LE, Merrick VM, Bannerman E, Russell RK, Basude D, Henderson P, et al. The rising incidence of celiac disease in Scotland. Pediatrics. 2013; 132: e924–31.
- White LE, Bannerman E, McGrogan P, Kastner-Cole D, Carnegie E, Gillett PM. Childhood coeliac disease diagnoses in Scotland 2009–2010. Arch Dis Child. 2013; 98: 52–6.
- West J, Fleming KM, Tata LJ, Card TR, Crooks CJ. Incidence and prevalence of celiac disease and dermatitis herpetiformis in the UK. Am J Gastroenterol. 2014; 109: 757–68.
- Zingone F, West J, Crooks CJ, Fleming KM, Tata LJ, Card TR, et al. Socioeconomic variation in the incidence of childhood coeliac disease in the UK. Arch Dis Child. 2015; 100: 466–73.
- Holmes GKT, Moor F. Coeliac disease in Asians in a single centre in southern Derbyshire. Frontline Gastroenterol. 2012; 3: 283–7.
- Holmes GKT, Muirhead A. Epidemiology of coeliac disease in a single centre in Southern Derbyshire 1958–2014. BMJ Open Gastroenterol. 2017; 4: e000137.
- Whitburn J, Rao SR, Paul SP, Sandhu BK. Diagnosis of celiac disease is being missed in over 80% of children. Eur J Pediatr. 2021; 180: 1941–6.
- Nartey Y, Crooks CJ, West J, Card TR, Tata LJ. Incidence and prevalence of coeliac disease in the United Kingdom. Ann Fam Med. 2023; 21(Suppl 2): 5051 (doi:10.1370/afm.22.s1.5051)
- National Institute for Health and Care Excellence. Coeliac disease: recognition, assessment and management (NG20). London: NICE. 2015.
- UK National Screening Committee. Screening for coeliac disease: an evidence map. London: UK NSC. 2025.
- Coeliac UK. Half a million people in the UK unknowingly living with an undiagnosed autoimmune disease. High Wycombe: Coeliac UK. 2025.
- All-Party Parliamentary Group on Coeliac Disease. Diagnosing coeliac disease: optimising the pathway for improved patient outcomes. London: All-Party Parliamentary Group on Coeliac Disease; 2023. Available from: https://www.coeliac.org.uk/app/uploads/appg-on-coeliac-disease-report.pdf