Review ArticleOpen Access, Volume 2 Issue 1
Bridging Compartmental Models and Network Analysis in Epidemiological Modelling
Jorge M Mendes1,3*; Helena Baptista1; Ying C MacNab2
1NOVA Information Management School (NOVA IMS), New University of Lisbon, Campolide Campus, 1070-312 Lisbon, Portugal.
2Epidemiology and Biostatistics, School of Population and Public Health, University of British Columbia Vancouver, Canada.
3NOVA Cairo, The Knowledge Hub Universities, New Administrative Capital, Cairo, Egypt.
*Corresponding author: Jorge M Mendes
NOVA Information Management School (NOVA IMS), New University of Lisbon, Campolide Campus, 1070-312 Lisbon, Portugal.
Received : Jan 19, 2024 Accepted : Feb 20, 2024 Published : Feb 27, 2024
Epidemiology & Public Health - www.jpublichealth.org
Copyright: Mendes JM © All rights are reserved
Citation: Mendes JM, Baptista H, MacNab YC. Bridging Compartmental Models and Network Analysis in Epidemiological Modelling. Epidemiol Public Health. 2024; 2(2): 1036.
Abstract
In this study, the authors undertake a comparative analysis of compartmental models and network analysis as means of simulating the propagation of infectious diseases. Compartmental models operate under the assumption of homogeneous mixing, which is often a flawed assumption as individuals tend to engage in varied contact patterns based on their surrounding environments. On the other hand, social network analysis accounts for the intricate web of interpersonal connections between individuals, thereby offering a more realistic portrayal of social behaviour. However, network analysis can be computationally demanding, rendering its application in real-time epidemic modelling challenging. By conducting a series of simulations utilising the SIR model and network analysis, the authors accentuate the merits of a hybrid modelling approach that integrates the strengths of both compartmental models and network analysis while mitigating their respective limitations. Additionally, the authors suggest plausible avenues for future research.
Background
Epidemiological modelling has played a crucial role in comprehending and managing the transmission of infectious diseases (Fitzpatrick et al. (2019), Gopal et al. (2021)). One of the primary strategies for tracking the course of an epidemic is compartmental modelling, which has been enhanced (e.g. Hethcote (2000), Abou-Ismail (2020), Mendes & Coelho (2021)) since the pioneering work of Kermac and McKendrick in 1927 (Kermack & McKendrick (1927), Kermack & McKendrick (1932), Kermack & McKendrick (1933)). Another approach is network analysis (Kiss et al. (2017)), which has been used to highlight specific disease spread mechanisms (e.g. Eames & Keeling (2002)). Both methods provide unique perspectives and limitations for simulating disease spread, and this study explores these methodologies in brief, highlighting their differences, limitations, and potential integrations for more accurate and computationally efficient simulations.
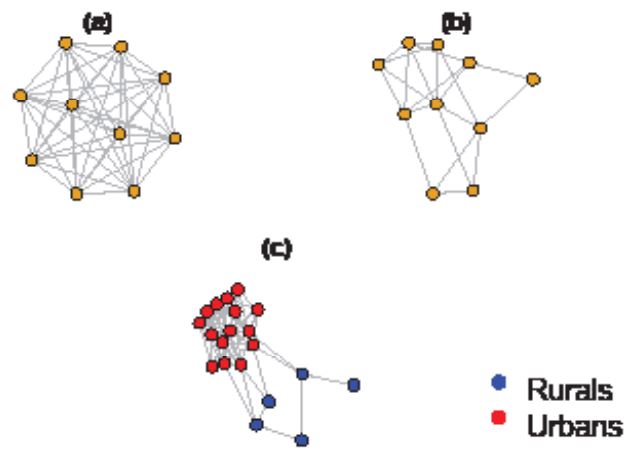
Compartmental models, such as the SIR model, are widely used to study the spread of infectious diseases. These models divide populations into distinct compartments, such as susceptible, infectious, and removed/recovered individuals, and rely on differential equations to capture the movement of individuals between these compartments. However, recent research has been using stochastic approaches (e.g. Ward et al. (2022) and Mendes & Coelho (2023)) for modelling the spread of diseases in real-world settings. The main assumption of compartmental models is homogeneous mixing, which assumes that individuals have equal contact probabilities with one another, regardless of their location or social context. This assumption is often unrealistic, as individuals have different contact patterns according to the environments they move around. For example, individuals in larger areas are less likely to interact with those who are far away (Anderson & May (1992)). In contrast, social network analysis takes into account the complexity of interpersonal connections between individuals (Figure 1). Each node in a social network can be in different states, and transition probabilities are influenced by the number and nature of contacts with infectious individuals. The homogeneous network model assumes equal connections for each node, while the heterogeneous model offers a more realistic representation of social behaviour. However, network analysis can be computationally intensive, making it challenging to apply in real-time epidemic modelling. Furthermore, individuals with more connections (super-spreaders) have a higher probability of transmitting the disease (Lloyd-Smith et al. (2005)).
Simulation scenarios and computational modelling
To illustrate our arguments, we propose a series of simulations using the SIR model and network analysis, using a stochastic approach. Assume that the time (in days) that an individual spends in a compartment is exponentially distributed (other more suitable distributions, such as Weibull, may be used) with some compartment-specific rate λ(t). The probability of extending the stay by a further period of length h (hereafter we consider h = 1 day) is exp(−λ(t)h), and the probability of leaving is therefore p = 1 − exp(−λ(t)h). Whether an individual moves or stays is a Bernoulli distributed variable with probability p, and a binomial distribution results from the summation over the individual Bernoulli trials assuming that they are independent and identical for all compartment members (Mode & Sleeman (2000)).
Consider a time discrete version of the SIR model given by the following equations:
S(t) = S(t − 1) − dI,
I(t) = I(t − 1) + dI − dR,
R(t) = R(t − 1) + dR,
dI ∼ Bin(S(t − 1),pdI), t = 1,...,T,
dR ∼ Bin(I(t − 1),pdR), t = 1,...,T,
N = S(t) + I(t) + R(t),
S(0) = N − i0, I(0) = i0, R(0) = 0, pdI = 1 − exp(−βI(t − 1))), t = 1,...,T, pdR = 1 − exp(−γI(t − 1))), t = 1,...,T.
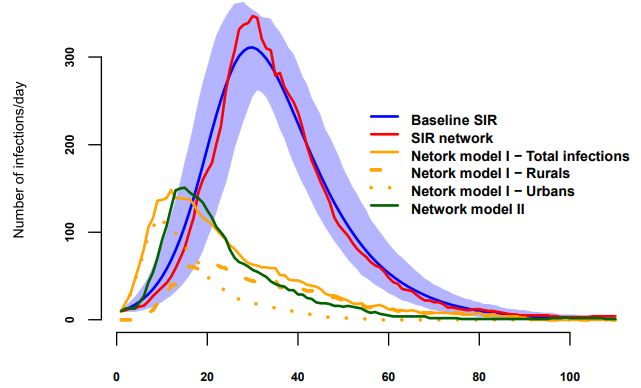
We used a population size of N=1,000 to compare the SIR baseline model with network models, which was sufficient to convey our points and simultaneaously computationally feasible. The epidemic began with 10 infectious individuals, β=0.0003, γ=1/10 (10-day infectious period), and t=0,110. To account for uncertainty, we ran the process 1,000 times, generating 1,000 replicates. The evolution of compartment I(t) is shown in Figure 1 (Baseline SIR), with the blue line representing the mean of the replicates and the light-blue shaded area indicating the 95% credible interval. We then transformed the SIR model into a network with 1,000 nodes and 50 connections each, ensuring homogeneity and reflecting the comprehensive nature of the network of potential links in the SIR model. The infection dynamics with 1,000 nodes and 50 links were identical to those in the SIR model without a network structure (SIR Network) after calibration of β to obtain a similar prevalence curve. The red line in Figure 1 approaches the blue line due to the small population size, falling within the 95% credible interval.
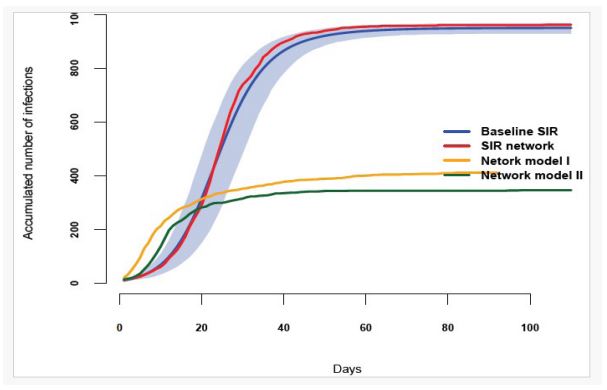
The second scenario (shown in Figures 2 and 3) as network model I and II assumes there are two clusters. One, the Urbans, has 800 nodes highly connected (85 connection each), and the second, the Rurals, has 200 nodes with 8 connections each, keeping the same average number of nodes, that is 50. Some of the Rurals are connected to nodes in the Urban cluster. We tried two distinct scenarios only differing on the location of the initial infections. Then we assume that the infection starts with five infectious Rurals and five infectious Urbans (Network model II). They are not very different. Indeed, the epidemic spreads at a slightly slower rate in this scenario compared to the previous one, which is expected due to the fewer number of connections among the Rurals. However, the rapid spread among the Urbans more than compensates for this, leading to a faster spread overall and a similar spike of the outbreak, although it ends earlier than the SIR network. In the long term, the infected population does not reach the levels of the first scenario due to the slower evolution of the outbreaks caused by the limited connections among the Rurals and the fast reduction of number of susceptible nodes in the Urbans cluster.
Integrating the two approaches: Frequently, when we have two infeasible extremes, the ideal solution lies in between. Here, using a hybrid approach to combine the strengths of both compartmental models and network analysis and mitigate their limitations can be achieved by:
1. Downscaling compartmental models to smaller geographical areas, for multi-compartment models, with homogeneous mixing within but heterogeneous mixing among them. Spatial neighbourhood and similarity matrices (e.g. Besag et al. (1991), MacNab (2022), MacNab (2023), Baptista et al. (2016), Baptista et al. (2020)), as used in disease mapping, can be incorporated to capture the regional dynamics of disease spread, considering factors such as population density and mobility patterns (mobile-generated data may be used in establishing dynamic mobility patterns).
2. Incorporating stochastic, time-varying heterogeneous contact matrices (Mendes & Coelho (2023)) based on localisation, age, and sex may help on assess the impact of public health measures (e.g. gathering bans, travel restrictions, lockdowns, etc.) across different demographics and geographical areas.
3. Incorporating the impact of various pathogenic variants on the infection mechanism model. Additionally, the infection mechanism should account for spatial variation in infection probability through spatial processes, such as spatial random fields or Markov random fields (e.g. Banerjee et al. (2015), MacNab (2023), Baptista et al. (2016)).
4. Incorporating, the impact and effectiveness of public health measures targeting either the reduction of probability of being infected, given a contact with an infectious individual (e.g. facial coverings) or the reduction of contacts among individuals (e.g. gathering bans) (e.g. Mendes & Coelho (2023)).
5. Incorporating additional compartments (e.g. Mendes & Coelho (2023)) to account for differential recovery rates, disease severity, and the consequent effects on healthcare resource utilisation, including hospitalisation and fatality rates.
Conclusion and future directions
As we illustrated herein, simulations can provide valuable insights into the dynamics of disease spread under different scenarios. These simulations will not only reinforce the theoretical aspects discussed but also offer practical examples of how epidemiological models can be adapted and applied to real-world scenario to gain a deeper understanding of the disease dynamics.
The fusion of compartmental models and social network analysis, as well as incorporation of spatial neighbourhoodand/ or similarity-matrices commonly seen in disease mapping, offers a promising pathway for more accurate and efficient epidemiological modelling. This integrative approach accommodates, as much as possible, the complexity of real-world social interactions and geographical variations as described, enhancing our ability to predict and manage infectious disease outbreaks.
Our future research shall focus on refining these hybrid models, exploring the impact of various social behaviours and public health interventions. Additionally, leveraging advancements in computational power and algorithmic efficiency will be crucial in realising the full potential of these sophisticated epidemiological models.
References
- Abou-Ismail, A. Compartmental models of the COVID-19 pandemic for physicians and physician-scientists. SN Comprehensive Clinical Medicine, 2. 2020. https://doi.org/10.1007/s42399-020-00330-z.
- Anderson RM, & May RM. Infectious diseases of humans. Oxford University Press. 1992.
- Banerjee S, Carlin BP, & Gelfand AE. Hierarchical modeling and analysis for spatial data. Chapman & Hall. 2015.
- Baptista H, Congdon P, Mendes JM, Rodrigues Ana M, Canhão H, & Dias SS. Disease mapping models for data with weak spatial dependence or spatial discontinuities. Epidemiologic Methods. 2020; 9: 20190025. https://doi.org/doi.org/10.1515/em-2019-0025.
- Baptista H, Mendes JM, MacNab YC, Xavier M, & Almeida JC. de. A gaussian random field model for similarity-based smoothing in bayesian disease mapping. Statistical Methods in Medical Research. 2016; 25: 1166-1184. https://doi.org/10.1177/0962280216660407.
- Besag J, York J, & Mollie A. Bayesian image restoration, with two applications in spatial statistics (with discussion). Annals of the Institute of Statistical Mathematics. 1991; 43(1): 1-59.
- Eames KT, & Keeling JM. Modeling dynamic and network heterogeneities in the spread of sexually transmitted diseases. Proceedings of the National Academy of Sciences of the United States of America. 2002; 13330-13335. Academy of Sciences of the United States of America. https://doi.org/10.1073/pnas.202244299.
- Fitzpatrick M, Bauch C, Townsend J, & Galvani A. Modelling microbial infection to address global health challenges. Nature Microbiology. 2019; 4: 1612-1619. https://doi.org/10.1038/s41564-019-0565-8.
- Gopal K, Lee L, & Seow H. Parameter estimation of compartmental epidemiological model using harmony search algorithm and its variants. Applied Sciences. 2021. https://doi.org/10.3390/APP11031138.
- Hethcote HW. Mathematics of infectious diseases. SIAM Review, 42. 2000. https://doi.org/10.1137/ S0036144500371907.
- Kermack WO, & McKendrick AG. A contribution to the mathematical theory of epidemics. Proceedings of the Royal Society of London. Series A, Containing Papers of a Mathematical and Physical Character. 1927; 115. https://doi.org/10.1098/rspa.1927.0118.
- Kermack WO, & McKendrick AG. Contributions to the mathematical theory of epidemic II - the problem of endemicity. Proceedings of the Royal Society of London. Series A, Containing Papers of a Mathematical and Physical Character. 1932; 138. https://doi.org/10.1098/rspa.1932.0171.
- Kermack WO, & McKendrick AG. Contributions to the mathematical theory of epidemics III - further studies of the problem of endemicity. Proceedings of the Royal Society of London. Series A, Containing Papers of a Mathematical and Physical Character. 1933; 141. https://doi.org/10.1098/rspa.1933.0106.
- Kiss IZ, Miller JC, & Simon PL. Mathematics of epidemics on networks - from exact to approximate models. springer Cham. 2017. https://doi.org/10.1007/978-3-319-50806-1.
- Lloyd-Smith JO, Schreiber SJ, Kopp PE, & Getz WM. Superspreading and the effect of individual variation on disease emergence. Nature. 2005; 438: 355-359. https://doi.org/10.1038/nature04153.
- MacNab YC. Bayesian disease mapping: Past, present, and future. Spatial Statistics. 2022; 50: 100593. https://doi.org/10.1016/j.spasta.2022.100593.
- MacNab YC. Adaptive gaussian markov random field spatiotemporal models for infectious disease mapping and forecasting. Spatial Statistics. 2023; 53: 100726. https://doi.org/10.1016/j.spasta.2023.
- Mendes JM, & Coelho PS. Addressing hospitalisations with nonerror-free data by generalised SEIR modelling of COVID-19 pandemic. Scientific Reports. 2021; 11. https://doi.org/10.1038/s41598-021-98975-w.
- Mendes JM, & Coelho PS. The effect of non-pharmaceutical interventions on COVID-19 outcomes: A heterogeneous agerelated generalisation of the SEIR model. Infectious Disease Modelling. 2023; 8(3): 742-768. https://doi.org/10.1016/j.idm.2023.05.009.
- Mode JC., & Sleeman, C. K. (2000). Stochastic processes in epidemiology. Singapore: World Scientific. Ward, C., Brown, G. D., & Oleson, Jacob. J. Incorporating infectious duration-dependent transmission into bayesian epidemic models. Biometrical Journal. 2022; 65. https://doi.org/10.1002/bimj.202100401.


